

Governance Surveys
Directorship Magazine

With safety programs stuck on lagging metrics that fail to prevent workplace injuries and death, here is what boards must do to shift to proactive, serious incident and fatality prevention.
Workplace safety programs are stuck in a rut, tracking measurements that focus on the past while failing to help prevent injuries and deaths. As the annual rate of workplace fatalities remains flat, boards must help management lead organizations toward a new approach—one that goes beyond government compliance.
Total Recordable Injury Focus
Despite a decade of safety efforts, workplace fatality rates remained essentially flat. In 2023, 4,543 people died in preventable workplace incidents, or 3 workers per 100,000, while 3,899 individuals died in 2013, or 2.9 workers per 100,000.
At the same time, an Occupational Safety and Health Administration (OSHA)-required metric—the total recordable incident rate (TRIR)—fell from 3.3 per 100 workers to 2.4. Many businesses use TRIR as their only measure of safety performance.
Using these standard compliance metrics, a company can experience its lowest incident rate on record while still having the same number of fatalities as previous years. While a company therefore appears safe, the risk to workers might still be high and disaster right around the corner.
Preventable Death Rates Versus Total Recordable Case Rates
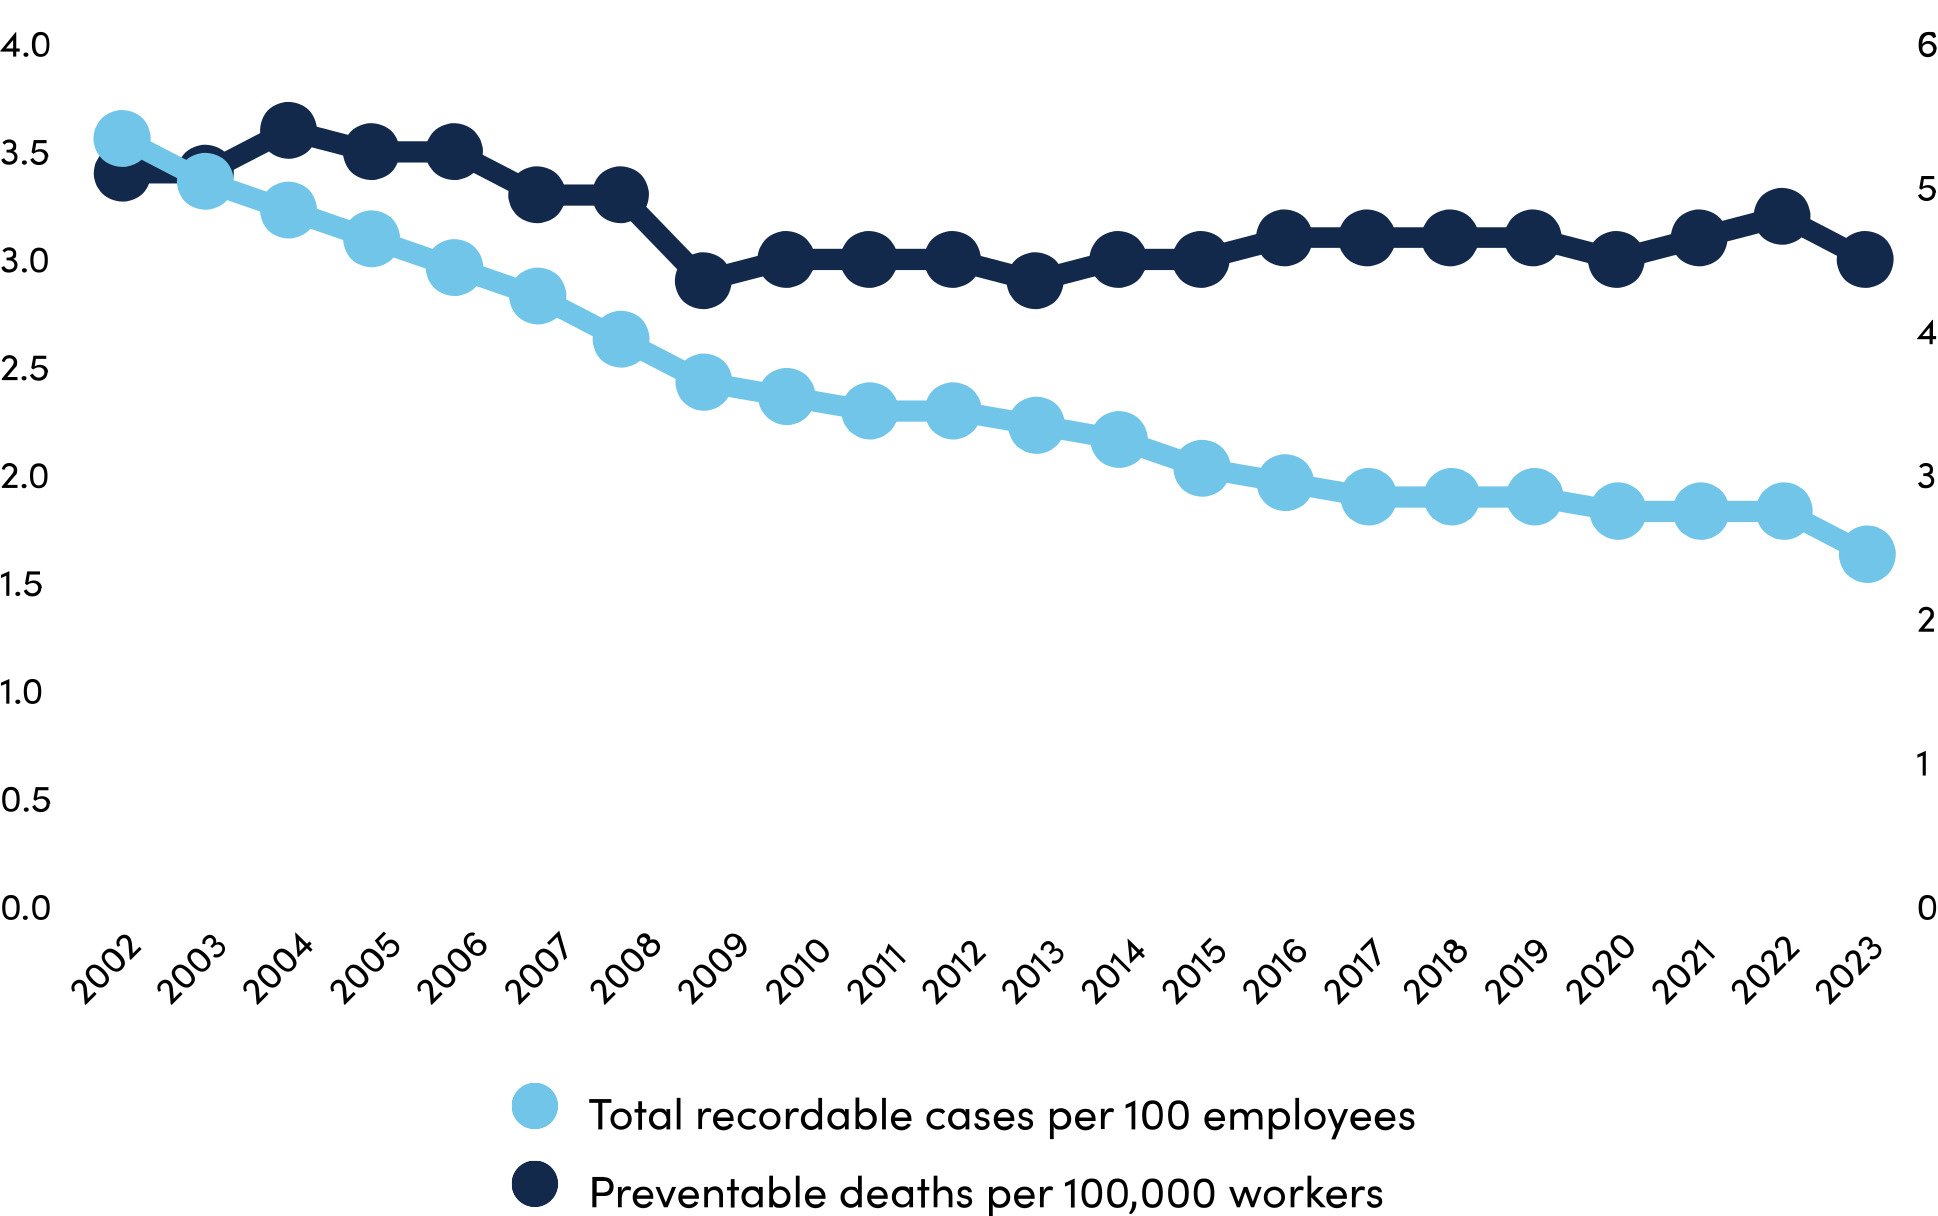
Source: National Safety Council
Low Rates Do Not Equal Low Risk
In 2010, the Deepwater Horizon rig exploded, killing 11 workers, injuring 16, and causing one of the largest environmental disasters in US history.
On the day of the disaster, the rig had achieved seven years without a lost-time incident, or any work-related injury or illness that prevents an employee from performing regular duties. This record proved that low rates do not equal low risk. While the industry-standard metrics used to track safety looked low, the risk for workers was extremely high.
The National Commission on the BP Deepwater Horizon Oil Spill and Offshore Drilling found that the disaster resulted from "a series of identifiable mistakes" that revealed "systematic failures in risk management," underscoring the critical role of board oversight in ensuring risks are identified, escalated, and controlled.
The Risk of Lagging Safety Metrics
Fifteen years later, many businesses and federal regulations still rely on incomplete measures, such as TRIR and lost-time incidents, to assess the effectiveness of a safety program. Often, these measures are reported to boards to show safety impact and progress, yet they do little to prevent serious incidents or assess risk in the workplace.
Modern safety professionals refer to them as “lagging indicators,” because they are capable only of tracking what has happened. This creates a reactive safety program rather than driving proactive action to avert high-risk outcomes.
The effect of an employee death is devastating and ripples through an organization and a community. Lagging indicators still play a role in maintaining enterprise-wide focus, but leading indicators are essential to drive proactive strategy and reduce serious incident potential.
Prioritize Focus to Control Risk
In recent years, a new way of thinking has taken root in the safety profession that seeks to prevent injuries and fatalities before they occur, rather than reacting to them. This new philosophy of safety, known as Serious Incident and Fatality (SIF) prevention, encourages businesses to let lagging indicators take a back seat. Common lagging indicators include the following:
- Days away, restricted, or transferred. These are cases where an injury or illness causes an employee to miss work, work with restrictions, or transfer to another job.
- Experience modification rating. This is a factor used by insurers to adjust workers' compensation premiums based on a company's past claims history.
- Lost time injury rate. These are work-related injuries that cause lost work time per 200,000 hours worked.
- Occupational illness rate. This is the frequency of work-related diseases or health conditions reported per 100 employees.
- TRIR. Beyond the definition discussed above, this also includes the number of work-related injuries and illnesses requiring medical treatment beyond first aid per 100 employees.
- Workers’ compensation claims. These are insurance claims filed when employees are injured or become ill due to their job, covering medical costs and lost wages.
With SIF, these lagging indicators are still tracked and reported, but new metrics, also known as leading indicators, become the main tools for reducing risk and tracking progress. SIF prevention is about finding high-hazard activities, conditions, and events, and building controls to prevent them from leading to injuries or fatalities.
The National Safety Council recommends the following examples of leading indicators organizations may consider using, based on their operations and risk profile:
- percentage of total potential SIFs with validated controls, which is the portion of high-risk situations that have proven safety measures in place to prevent serious injuries or deaths;
- employee and leadership engagement in safety activities;
- proactive observation reporting;
- safety audit scores;
- SIF prevention training completion;
- SIF risk assessment;
- SIF risk corrective action closure rate, or the speed at which identified high-risk hazards are addressed and resolved; and
- verification of critical controls.
The Safety Strategy Conversation
In a SIF prevention-based safety program, lagging indicators are collected and presented to regulators, investors, shareholders, industry groups, and trade associations but are used only as a record of what occurred, not as a reliable assessment of safety maturity, risk reduction, or progress. Leading indicators become the primary metrics presented at board meetings, offering a more accurate picture of workplace risk and helping shape the enterprise-wide safety strategy.
For the highest-risk industries, including agriculture, construction, manufacturing, transportation, and warehousing, this shift can be game-changing. A strong SIF prevention program empowers all employees to identify risks so that critical controls can help prevent harm. These risks often revolve around energy, including gravity, electrical, chemical, and motion, such as vehicle crashes, slips, falls from heights, contact with machines, and falling objects.
SIF prevention posits that with the knowledge of where a company’s energy-based risks lie, it can implement controls that build in the capacity for human error through technology, infrastructure, and policies so that mistakes don’t lead to the worst possible outcomes.
The Board’s Role
Safety should be the top value for everyone at an organization, including board members. If board meetings don’t include safety performance updates, directors should request that the safety or operations executive present on the topic regularly.
Additionally, directors should spark the conversation on SIF prevention by asking management for leading indicators they think will demonstrate risk reduction progress, and whether they are using the ASTM 2920 voluntary standard—a framework for consistent safety metrics and SIF prevention—or other benchmarks to influence their strategy. This will allow the company to set meaningful targets for risk reduction, while reducing focus on benchmarking lagging indicators.
Many companies, including Dow, ExxonMobil Corp., and AECOM, are open about their SIF prevention plans and results. These organizations share how they identify SIF potential in their workplace, train employees to prevent those incidents, and keep communication open with employees so they understand their role in reporting and correcting hazards.
The board’s governance structure should also align with the inherent risks in a company’s operations. For high-risk industries, this can include establishing a dedicated committee or subcommittee responsible for reviewing safety performance, assessing risk management strategies, and overseeing the implementation of SIF prevention programs.
Finally, boards should consider updating existing compensation metrics to reflect SIF prevention-based leading indicators that demonstrate meaningful risk reduction. When serious work-related SIFs occur—particularly where known risks were not adequately controlled—boards should conduct a rigorous accountability review and reflect those findings in performance outcomes.
Supporting SIF Transformation
By early 2026, an update to the ASTM 2920 standard is expected to include more detailed leading indicators and SIF prevention principles, offering a roadmap for how organizations can measure safety with a SIF-prevention focus. Boards should not wait for management to adopt these voluntary standards. By asking whether their organization is prepared to make this shift and demanding metrics that demonstrate real risk reduction, directors can drive transformation today.
Boards can be the catalyst for a new era of workplace safety—one that finally bends the curve on fatalities and ensures everyone makes it home safely.
The views expressed in this article are the author's own and do not represent the perspective of NACD.

Lorraine Martin is the CEO of the National Safety Council, America’s leading nonprofit safety advocate with a legacy of eliminating preventable deaths and injuries in workplaces and on roadways.
Final Days to Save $1,500
on NACD Directors Summit™
2026 Registration
Register by Thursday, April 30 to take advantage of this exclusive discounted pricing.
October 11-14, 2026
The Gaylord National Harbor | Washington, DC Area